Get signals before everyone else does
Cut through endless headlines. See which stories and themes are gaining traction so you know what to read first—without a terminal or a research team.
See what a share price already pays for — and what it refuses to pay for — before you take the other side. Free, no account. Plus two tools that bring the signals to you.
Start free in seconds — pick one, or all three
Open any ticker and read the story its price already tells: what the market is paying for, what it declines to pay for, and the one question that settles it.
Platform-run Stage 2 setups, breakouts and fundamentals. Subscribe once; results hit your inbox.
You choose the exact tickers and tags — we send a daily PDF of just their news, summaries and market impact, an hour before the open. Built around your watchlist, no one else’s.
See it first
A genuine sample of each free tool — the morning briefing PDF, the latest momentum screening, and a live price narrative. No account needed.
Narrative trading
A share price is a vote on a set of claims. Narrative trading is reading that vote before you take the other side — what the price already pays for, what it refuses to pay for, and the single question that settles the difference. We reconstruct it from every published analyst model on the name, the reported segments and a reverse-DCF. Free on 609 tickers, no account.
Anything widely reported is already in the number. Buying a story everyone has read is paying full price for old news.
The rejected models are the opportunity. They name the specific upside — and downside — the market is currently declining to fund.
Most disagreements come down to a single variable. Know which one, and you know exactly which headline to act on and which to ignore.
AAPL
20 published analyst models · as of 2026-08-31
Where the price sits
How it works
Track narratives as they build—AI infrastructure, rate expectations, energy policy—before they become headlines everywhere.
Get a clear picture of which companies sit closest to a story so you know where to look, not just what happened.
Filter by the factors you care about—growth, value, sector, risk—and keep your process consistent without manual spreadsheets.
Why it works
You don't need a desk full of monitors. Follow themes, see exposure, and narrow ideas—before the market has already moved.
Cut through endless headlines. See which stories and themes are gaining traction so you know what to read first—without a terminal or a research team.
Turn "what's everyone talking about?" into "what might affect the names in my brokerage or IRA?"—before the connection is obvious everywhere else.
Whether you check in daily or on weekends, less doom-scrolling, fewer "what did I miss?" moments, and a shorter path from headline to decision.
What you get
Watch how narratives build over time so you're not reacting to every headline in isolation—or missing the ones that actually matter.
Get a clear picture of which companies and industries sit closest to a story—before the market has priced it in.
Focus on the factors that matter to you—growth, value, risk, sectors—and keep your process consistent without spreadsheets you maintain by hand.
Straight answers
Retail and self-directed investors who manage their own accounts—taxable brokerage, IRA, or both—and want news tied to opportunities, not noise.
Most screeners start with static filters. News Impact Screener starts with what's happening in the world and shows what it might push on in the market—so you're not the last to know.
What would it mean to catch major news before everyone else? Less scrambling, fewer "I should have seen that coming" moments, and a watchlist you actually understand.
Early access
It seems like you want fast, reliable insight—without digging through hours of news. Join the list and get signals before the market reacts. Built for people who invest their own money and want context, not chaos.
Free. No spam. Takes 30 seconds.
| Symbol | Sector | Sub Sector | RS Rank |
|---|---|---|---|
| WST | Healthcare | Medical - Instrum… | 86 |
| AAPL | Technology | Consumer Electron… | 87 |
| BOW | Financial Services | Insurance - Prope… | 87 |
| IEX | Industrials | Industrial - Mach… | 87 |
| MET | Financial Services | Insurance - Life | 87 |
| TSM | Technology | Semiconductors | 87 |
| APH | Technology | Hardware, Equipme… | 88 |
| EQH | Financial Services | Asset Management | 88 |
AAPL
20 published analyst models
The market is 11% below the median target — more cautious than the analysts.
The market is 11% below the median target — more cautious than the analysts.
The price sits at the 25th percentile of the 20 published models, leaning bearish versus the median $360 target, and requires revenue growth of 17.3% annually—far above the 6.4% just delivered—meaning the market is already paying for significant acceleration.
The price pays for
The price refuses to pay for
What the disagreement turns on
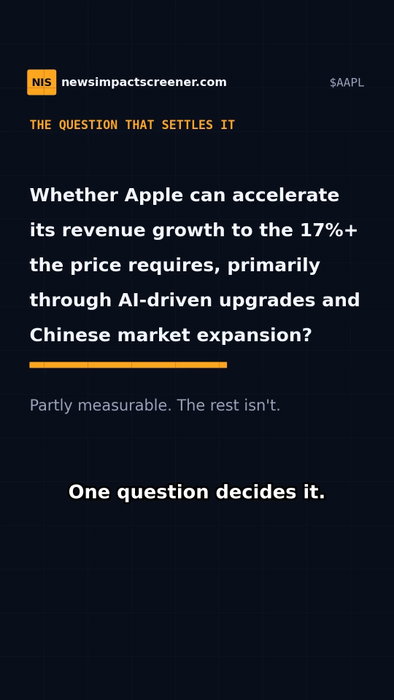
Whether Apple can accelerate its revenue growth to the 17%+ the price requires, primarily through AI-driven upgrades and Chinese market expansion, which can only be partially settled by tracking consumer attention and unit volumes.
Written by a language model from the published models, the reported segments and a reverse-DCF — not a recommendation, and not a house view.
Daily regime reads, top-story breakdowns, and watchlist setups — the screener's signal, in 30 seconds a day.
20 analysts publish a price target on Apple ($AAPL). The share price agrees with 3 of them — and refuses to pay for 8. They range from $245 to $400. The median is $360. At $319.70 the stock sits 11% below it. WHAT THE PRICE ALREADY PAYS FOR ✓ iPhone and Services growing at today's pace: 4.2% and 13.5% a year ✓ A 23.7% free-cash-flow margin, held indefinitely ✓ Component cost pressure and supply constraints ✓ Tim Cook's departure — public, and already absorbed WHAT IT REFUSES TO PAY FOR ✕ The full AI + Services monetization bull case — the four $375–$400 models, up to 25% above the price ✕ Margin compression and a growth stall — the four $245–$264 models, 18–23% below THE ONE QUESTION Can Apple accelerate revenue growth to the 17%+ the price requires — against 6.4% just delivered — through AI-driven upgrades and China? Partly measurable: unit volumes and attention can be tracked; the rest can't yet. That's the whole reading. Nothing held back. 569 US companies, rebuilt nightly — Apple's is at newsimpactscreener.com/quote/AAPL (link in bio). Reconstructed 31 Aug 2026 from 20 published analyst models. Not financial advice — a reading of what the price contains is not a forecast of where it goes.
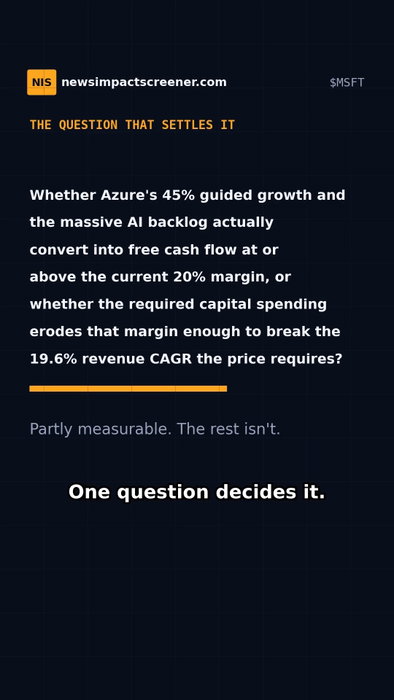
View21 analysts publish a price target on Microsoft ($MSFT). The share price agrees with 12 of them — and refuses to pay for 7. They range from $400 to $690. The median is $525. At $501.02 the stock sits 5% below it. WHAT THE PRICE ALREADY PAYS FOR ✓ Azure past $100B, growing ~43% a year ✓ The $678B commercial backlog, read as confirming today's trajectory, not beating it ✓ Revenue growth near 18%, operating margin near 47% ✓ Cloud demand accelerating across every hyperscaler WHAT IT REFUSES TO PAY FOR ✕ Copilot + Azure AI pushing growth high enough for a 28–38% premium — the bull models up to $690 ✕ AI capex swamping free cash flow and squeezing margins — the $400 bear model, ~20% down ✕ Google Cloud's 82% growth taking real share from Azure THE ONE QUESTION Does the AI backlog turn into free cash flow at a 20%+ margin — or does the capex needed to deliver it erode that margin and break the 19.6% revenue growth the price requires? Revenue conversion can be tracked; the margin pressure can't yet. That's the whole reading. Nothing held back. 569 US companies, rebuilt nightly — Microsoft's is at newsimpactscreener.com/quote/MSFT (link in bio). Reconstructed 1 Sep 2026 from 21 published analyst models. Not financial advice — a reading of what the price contains is not a forecast of where it goes.
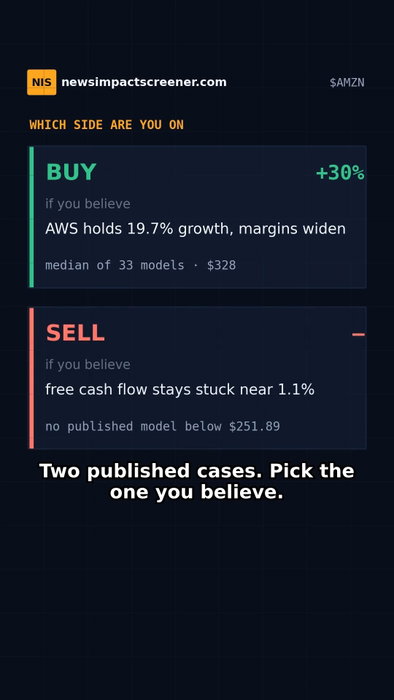
View33 analysts publish a price target on Amazon. The share price sits below every one of them. $251.89 against a $328 median. Which side are you on? → BUY if you believe AWS holds 19.7% growth and margins widen. Median of 33 models: $328, +30%. → SELL if you believe free cash flow stays stuck near 1.1% of revenue. No published model sits below the price — the lowest is $305. WHAT THE PRICE ALREADY PAYS FOR ✓ $716.92B revenue and the 12.4% growth just delivered ✓ An 11.2% operating margin, 50.3% gross ✓ $7.7B in free cash flow — about 1.1% of revenue ✓ Macro headwinds: Strait of Hormuz disruption, high rates WHAT IT REFUSES TO PAY FOR ✕ AWS holding 19.7% growth with expanding margins — the case for $305+ ✕ Advertising holding 22.1% growth despite the FTC lawsuit ✕ A free cash flow margin climbing from 1.1% toward the mid-teens ✕ $700B+ of hyperscaler AI capex turning into AWS contract wins THE QUESTION: can AWS and Advertising accelerate enough to lift the FCF margin toward the mid-teens? Partly measurable: attention and unit volumes show early; the margin only when Amazon reports. The whole reading, nothing held back. 547 US companies, rebuilt nightly: newsimpactscreener.com/quote/AMZN (link in bio). Reconstructed 10 Sep 2026 at $251.89 from 33 published models. Other people's targets, not our forecast. Not financial advice.
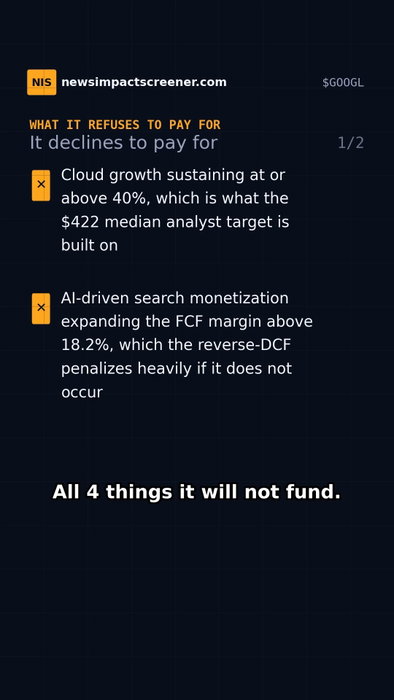
View18 analysts publish a price target on Alphabet. The share price sits below every one of them. $337.12 against a $422 median. Which side are you on, according to the analysts? → BUY if you believe Google Cloud grows 40%+ a year. Median of 18 models: $422, +25%. → SELL if you believe Cloud holds ~36% and margins stay flat. Careful — no published model sits below the price at all. WHAT THE PRICE ALREADY PAYS FOR ✓ Search growing near its 13.4% pace ✓ The DOJ ad-tech remedy — largely dismissed after the court rejected a forced AdX sale ✓ A 4.8% 10-year yield and macro risk ✓ Cloud at ~35.8% growth, no acceleration ✓ An 18.2% FCF margin, held flat WHAT IT REFUSES TO PAY FOR ✕ Cloud sustaining 40%+ — what the $422 median is built on ✕ AI lifting search margins above 18.2% ✕ A re-rating if rates fall or geopolitics ease ✕ Any value for Waymo or Other Bets THE QUESTION: does Cloud hold 35%+ and does AI expand search margins? Partly measurable — Cloud's growth prints every quarter; the margin half, nothing we have wired can settle. That's the whole reading, nothing held back. Rebuilt nightly for 546 US companies: newsimpactscreener.com/quote/GOOGL (link in bio). Reconstructed 2 Sep 2026 at $337.12 from 18 published models. Those are other people's targets, not our forecast. Not financial advice.
ViewLive experiment
Season 1 · runningPaper trading — no real money is at risk, and none of this is investment advice.